
Quarterley Review
January 1 - March 30, 2026
01.
Summary
Overall workforce wellbeing remains positive, with encouraging improvements in the number of workers reporting feeling Happy and Fine compared to the previous quarter. While responses indicating Anger and Anxiety have declined, there has been a slight increase in workers reporting Sadness, highlighting an area worth monitoring over the coming months.Overall engagement with the platform remains strong, with an average response rate of 76% across all eight scheduled check-ins.
Key Highlights
Average response rate remained strong at 76%
Workers reporting Happy increased by 16%
Workers reporting Anxious decreased by 21%
Resource engagement increased by 4%
Support Team connections increased by 26%
Crisis support resource engagement decreased by 12%
Key Concerns
Reports of Sadness increased by 17%
Resource engagement increased by 4%
02.
Wellbeing Analytics
Emotion Trends
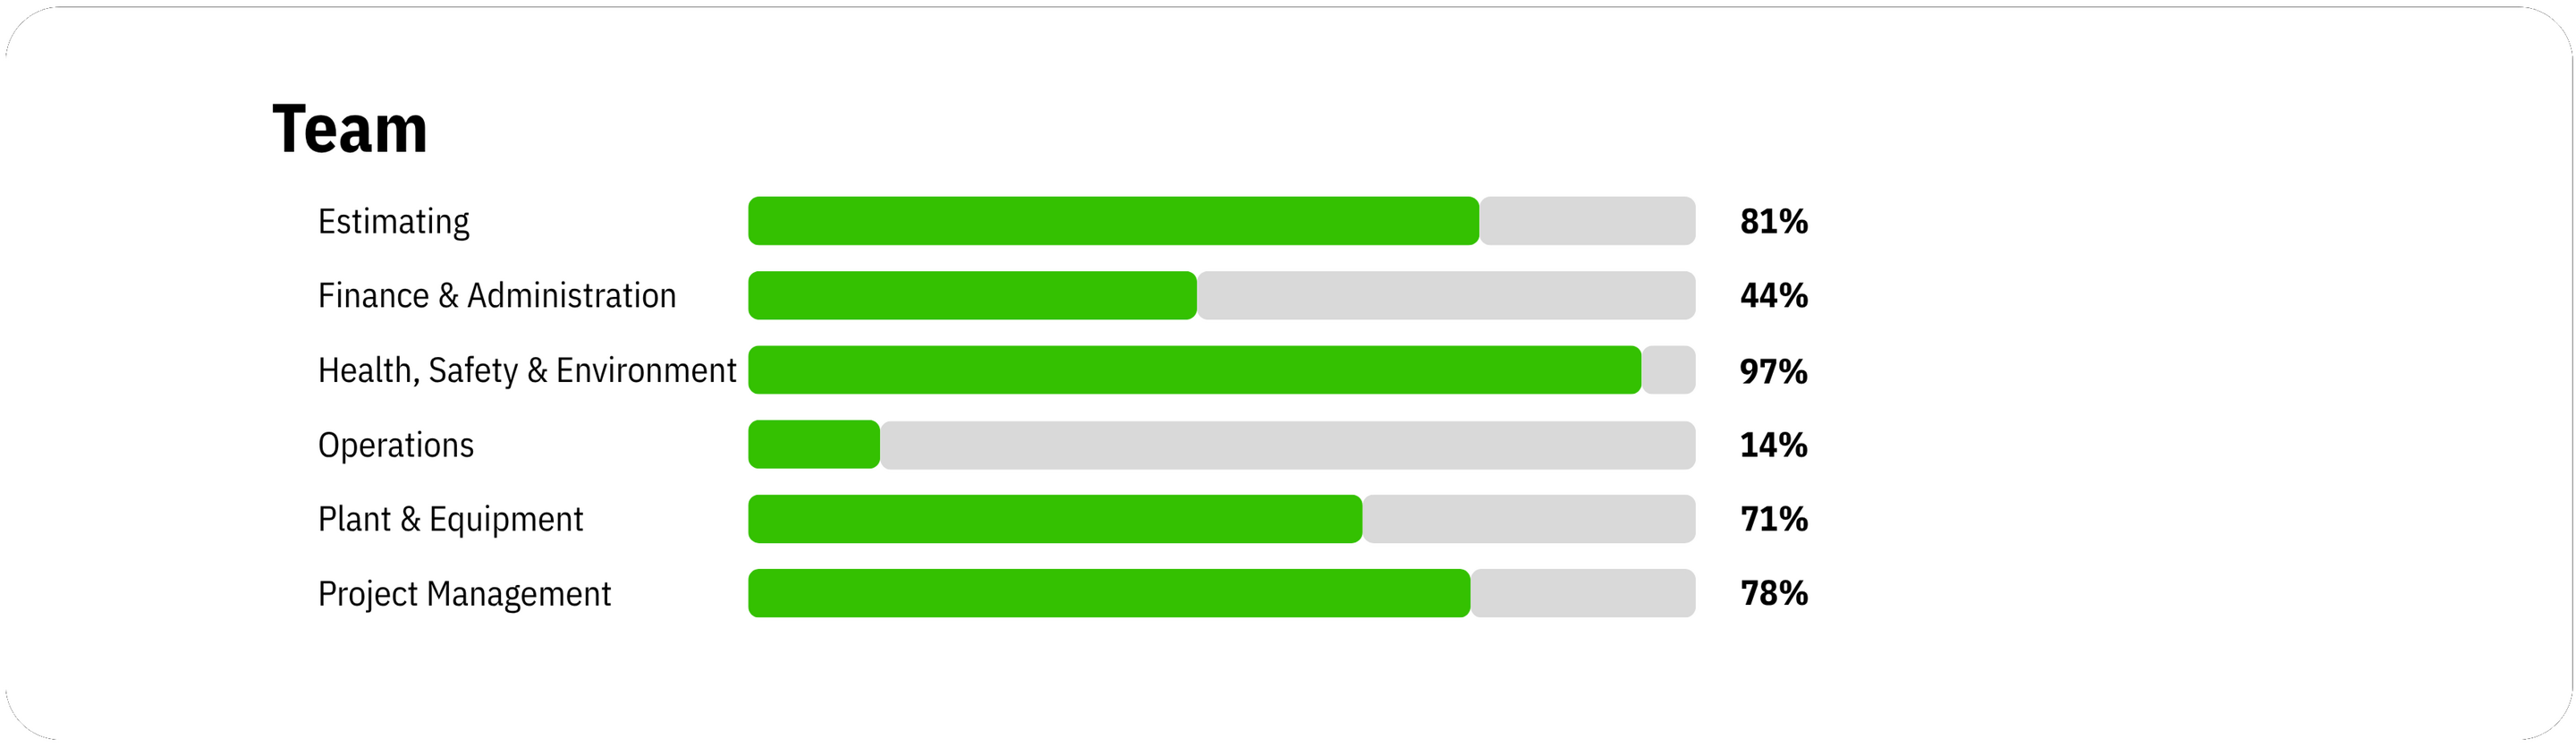
Team Comparisons
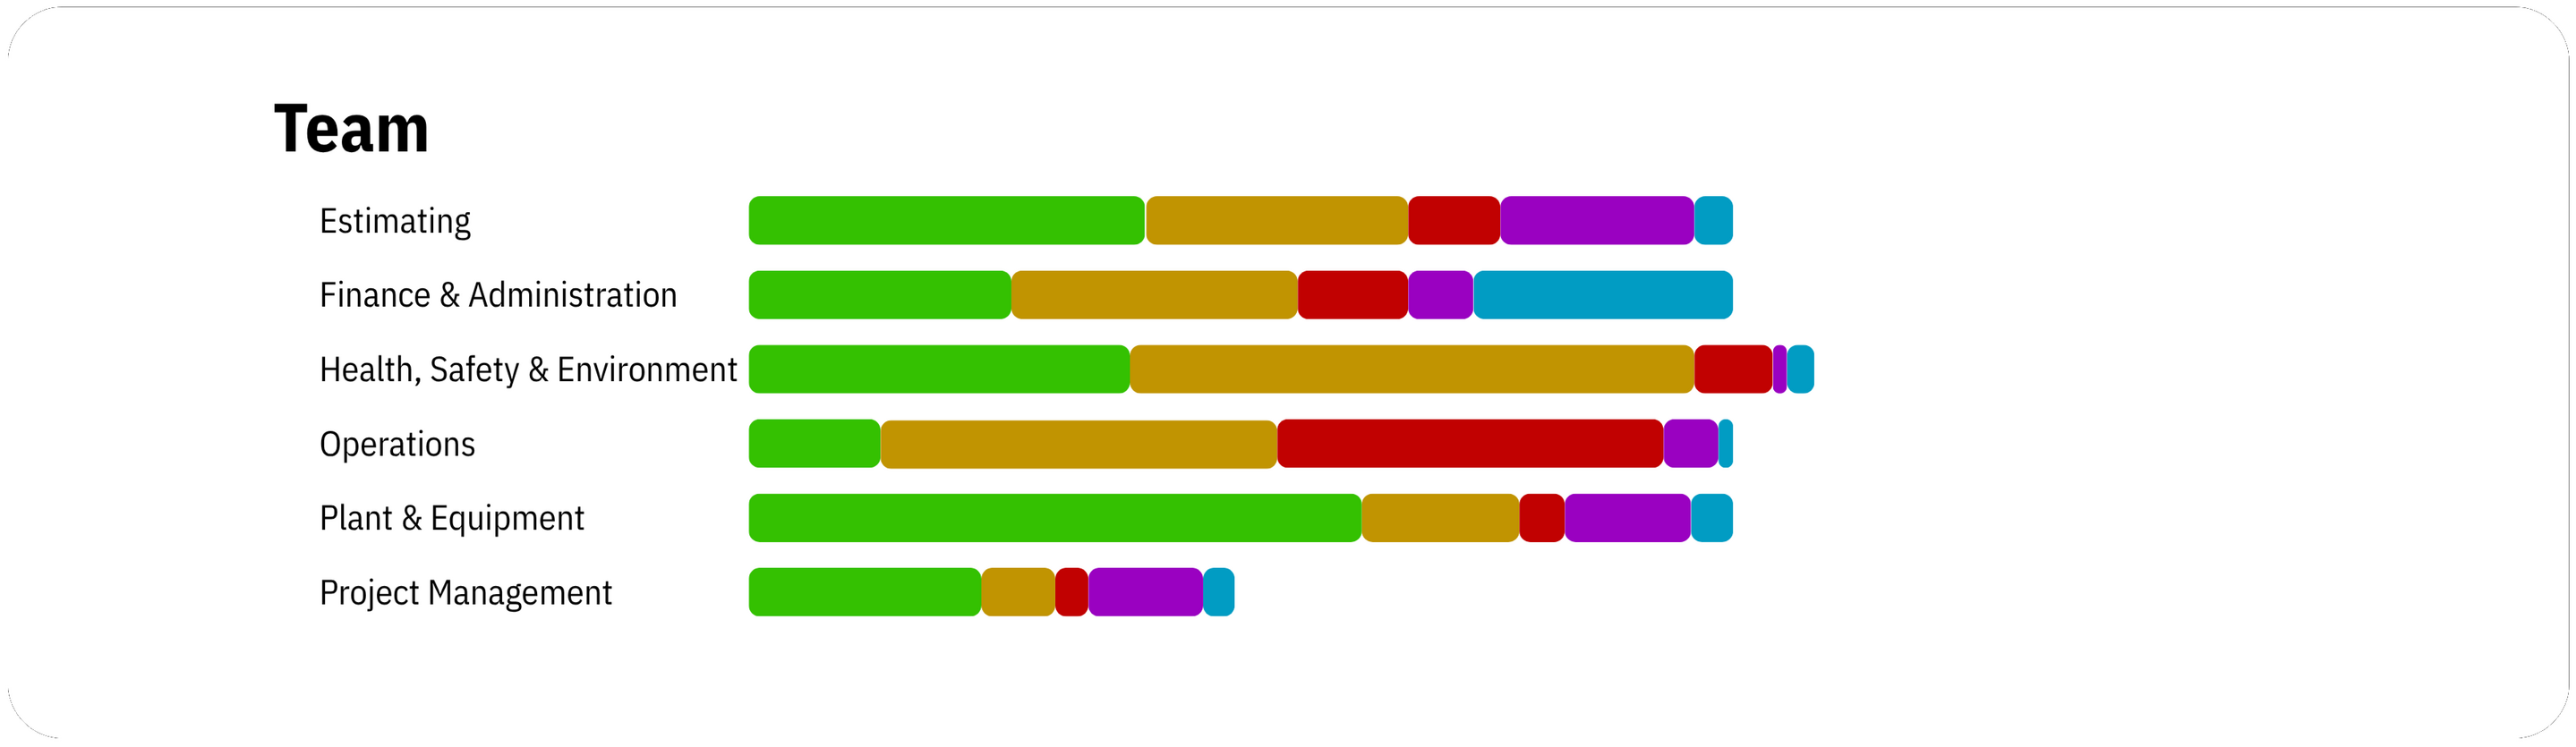
Happiest Teams
Plant & Equipment
Estimating
Health, Safety & Environment
Least Happy Teams
Operations
Top Contributing Factors To Worker Unhappiness
1. Workload & Job Demands
2. Financial
3. Workplace Culture & Relationships
03.
Engagement Metrics
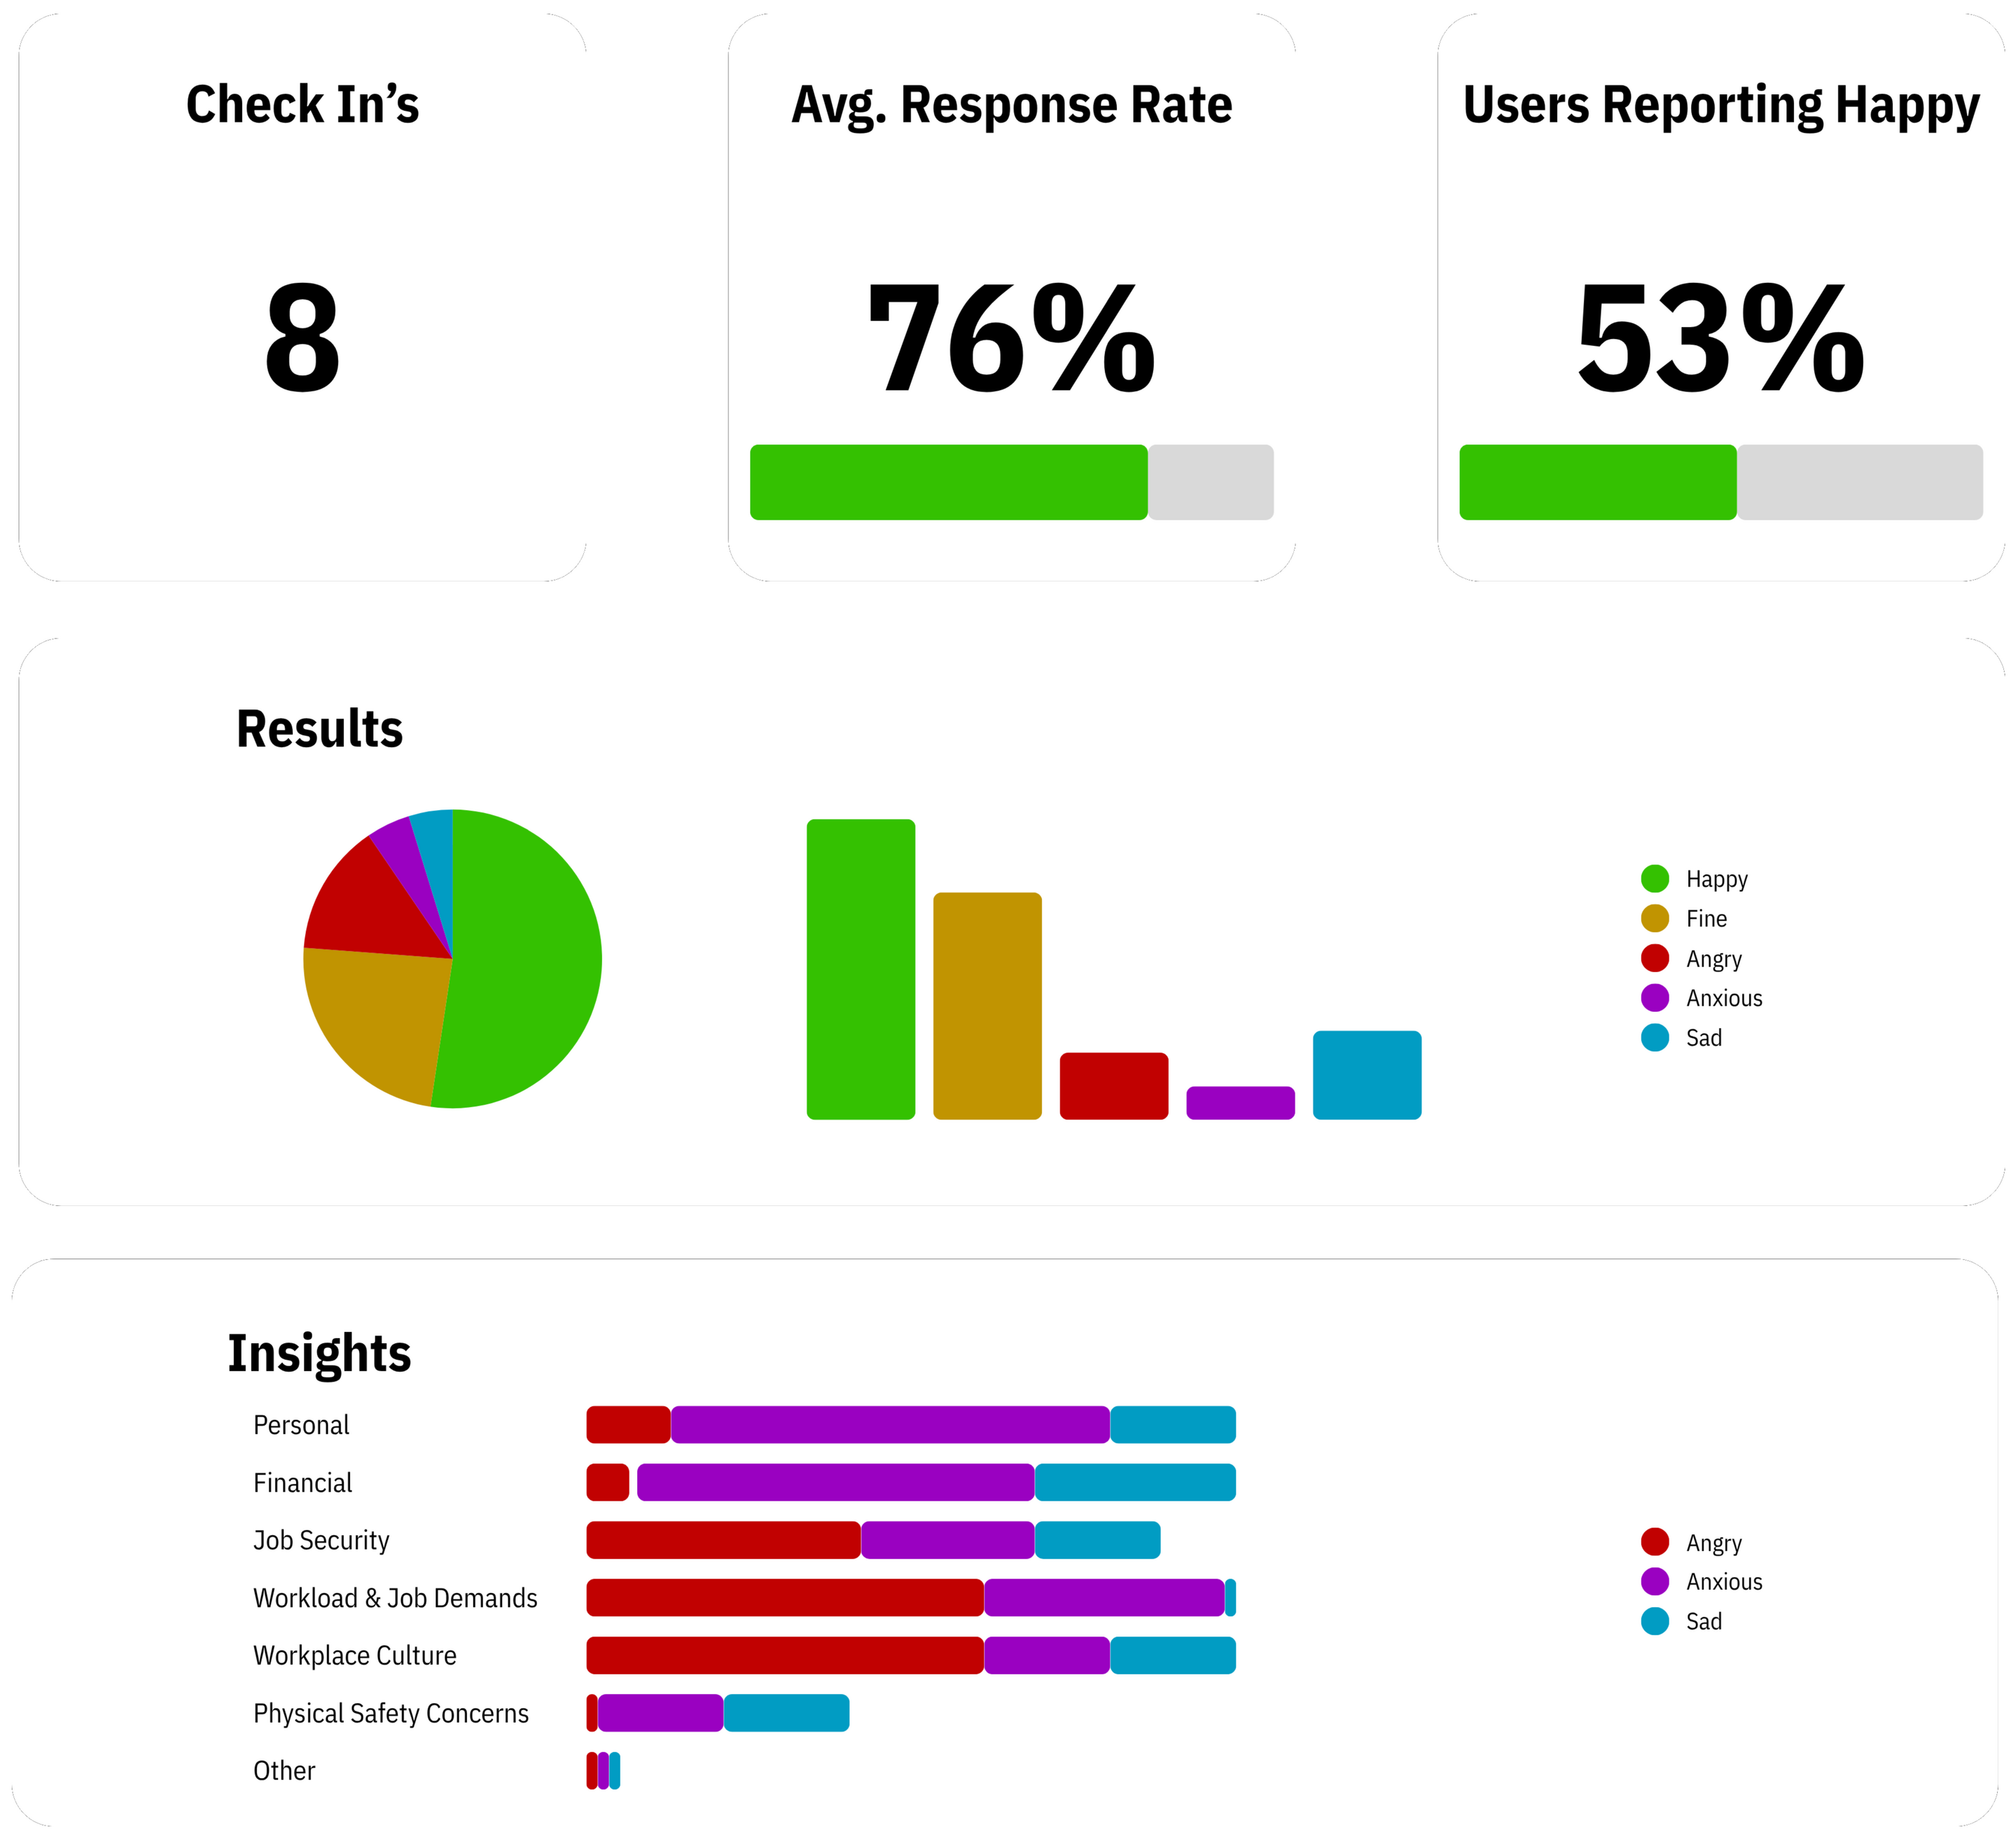
Overall Participation
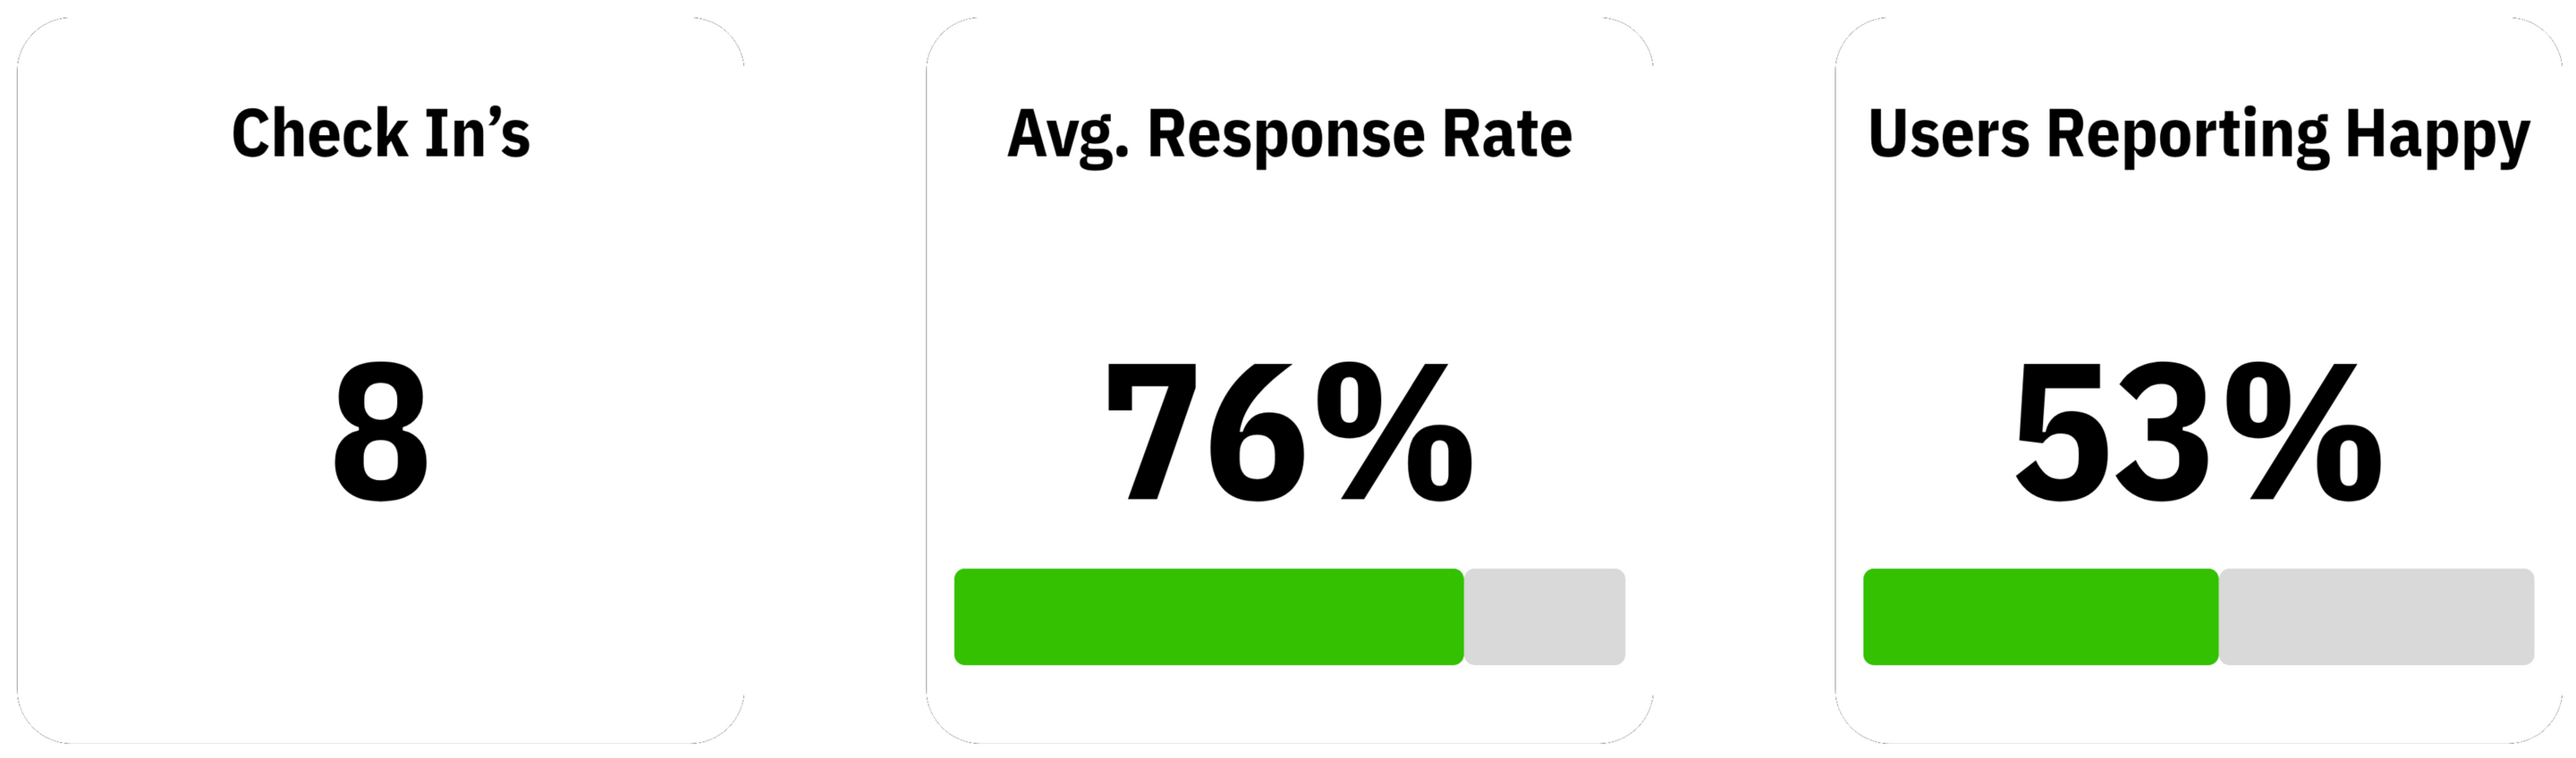
Total Check In's Sent: 8
Average Response Rate: 76%
Average Users Reporting Happy: 53%
Participation by Team
04.
Support Utilization
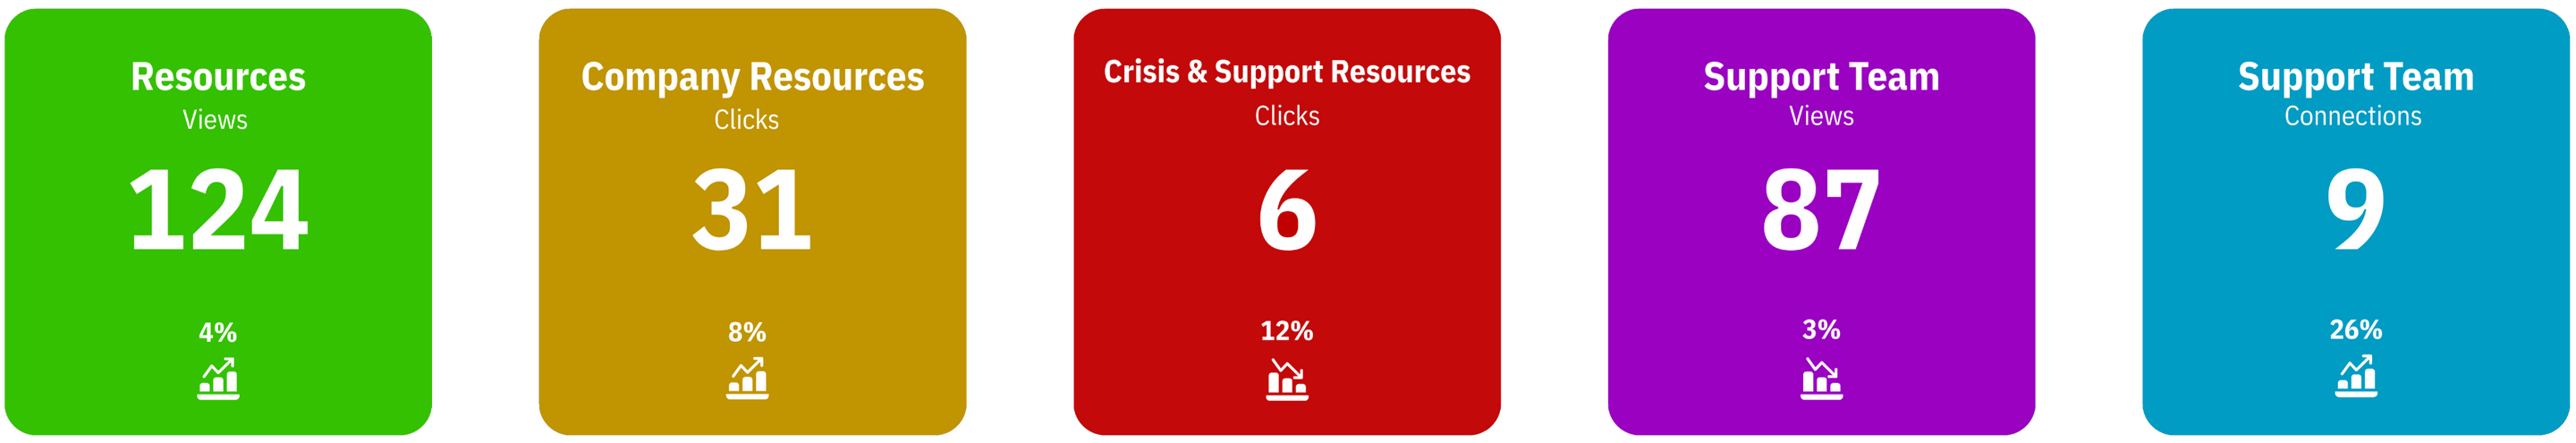
Resource engagement remains healthy, with an increase in workers accessing company wellbeing resources. While engagement with crisis resources has declined, the increase in Support Team connections suggests more workers are seeking assistance through internal support pathways.
05.
Emerging Themes
Several notable trends emerged during the reporting period:
Workers reporting Happy increased by 16%, suggesting overall workforce morale has improved.
Reports of Sadness increased by 17%, despite reductions in Anxiety and Anger.
Workload continues to be the most commonly selected contributing factor.
Resource engagement continues to increase, demonstrating growing awareness of available wellbeing resources.
Support Team connections increased significantly, indicating workers are becoming more comfortable accessing support.
06.
Strategic Insights
Based on this quarter's data, several opportunities have emerged:Positive MomentumOverall wellbeing appears to be improving, with more workers reporting positive emotional states and fewer reporting Anxiety.Workload Remains a Key DriverWorkload continues to be the most commonly reported contributing factor and may be influencing the increase in workers reporting Sadness.Support Awareness is ImprovingThe increase in Support Team connections suggests growing trust in available support pathways, although additional promotion of other resources like your EAP may improve awareness of external support options.
07.
Recommended Actions
Continue promoting internal support servicesSupport Team connections continue to increase, suggesting workers are engaging with available support. Continue reinforcing awareness through toolbox talks and internal communications.Promote fatigue and workload managementGiven workload remains the leading contributing factor, consider implementing additional communication around workload management, fatigue awareness and work-life balance.Increase awareness of crisis support servicesWhile internal resource engagement increased, crisis resource engagement declined slightly, suggesting there is less need in a positive way, however consider highlighting external support options during future wellbeing campaigns.Maintain strong participationA 76% response rate provides meaningful workforce insights. Continue promoting participation to maintain representative workforce data.
08.
Quarter-on-Quarter Comparison
| Metric | Previous Qtr | Current Qtr | Change |
|---|---|---|---|
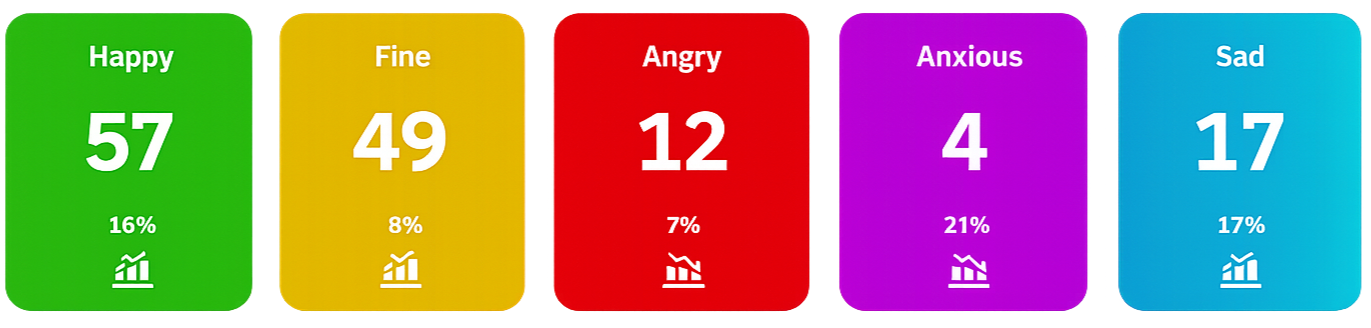
| Happy | 49 | 57 | +16% |
| Fine | 45 | 49 | +8% |
| Angry | 13 | 12 | -7% |
| Anxious | 5 | 4 | -21% |
| Sad | 15 | 17 | +17% |
| Response Rate | 66% | 76% | +10pts |
| Resource Engagement | 119 | 124 | +4% |
| Company Resource Clicks | 29 | 31 | +8% |
| Support Connections | 7 | 9 | +26% |
Overall AssessmentOverall, workforce wellbeing appears stable with several encouraging indicators, including higher positive sentiment, strong response rates and increased engagement with support pathways. While reports of sadness and workload-related concerns warrant ongoing attention, there are no indicators of widespread deterioration in workforce wellbeing. Continuing regular check-ins and targeted wellbeing initiatives should help maintain this positive trajectory while addressing emerging areas of concern.

Let's chat


This review was put together by Pete Smith, Founder & CEO of Confyde.If you'd like to discuss any of the findings, explore emerging trends, or talk through recommendations for your organization, I'd be happy to help.